2018 UK Entitlement Trading Market Report
Please view below or to download a copy click here.
UK ENTITLEMENT TRADING MARKET REPORT – CLAIM YEAR 2018
2018 ENGLAND BPS ENTITLEMENT TRADING OVERVIEW
There can be no doubt that since the 2016 Referendum Brexit and the UK Government’s continuing vagueness about the future of farm subsidies once we leave the EU has affected the demand and prices offered for entitlements. Although Philip Hammond had confirmed that prior to the 2018 trading deadline UK farmers will continue to receive BPS monies up until the 2019 scheme year (i.e. June 2020 when the 2019 BPS payment window closes), and that “the same level of funding” would be available to UK farmers for at least a number of years beyond 2019, there was still no formal legally binding announcement about whether the RPA will continue to use the current entitlement system for distributing and calculating payments beyond 2019, or whether they would move to a different system that made entitlements obsolete. The House of Commons briefing paper published in January 2018 entitled “Brexit: Future UK agriculture policy” hinted however that the Government inclination is for the current system to remain for a number of years, albeit no doubt adjusted, as stated in section 3.1:
“To transition to the new approach in England, the UK Government has set out the following steps (which will be subject to consultation):
- The Basic Payment Scheme 2019 … will be paid on the same basis as now.
- Envisage guaranteeing that BPS payments continue for a transition period in England for “a number of years” beyond the agreed implementation period with the EU, depending on the consultation. Mr Gove suggested 5 years in a Q&A after his speech.
- Propose to use this transition to reduce the largest BPS payments in England either by a maximum cap or a sliding scale of reductions.
- After the implementation period, the transitional payment could be made without adhering to cross-compliance rules. Instead, risk based inspections would be made and payment guarantees as long as domestic animal welfare, environmental and other laws were observed.
- After the implementation + transition period, Defra will replace the BPS with a system of public money for public goods.
The Government subsequently proceeded with a consultation headed “Health and Harmony: the future for food, farming and the environment in a Green Brexit”, which still provided no definitive information about the Government’s intentions going forward prior to the deadline on the 15th May.
Therefore those buying entitlements in 2017/2018 could only be sure of two further years’ of BPS claim payments (2018 and 2019), as opposed to having any confidence that English/UK entitlements might “roll-over” into whatever new subsidy scheme the EU would start after their next CAP review, as they did in 2014. And even if they did rollover into a new UK agricultural subsidy, there was little confidence that the payment levels would remain at the same sort of level, particularly with the talk of a reducing payment per hectare over any transition period, and a cap on payments to the larger farmers. This inevitably had an effect on sale prices in 2018.
How our graphs are prepared
As in last year’s edition of our end of trading season market report, we are again publishing raw data graphs illustrating in detail how the different regional Entitlement markets behaved during the 2018 trading period, which for England with us started in September 2017, and ended on the 15th May 2018. Because we use only raw data, there have been no adjustments such as averaging prices for a week or a day, rounding up or down, and any contributions towards the vendor’s sale costs made by purchasers of small lots on top of the purchase price per entitlement are excluded. These graphs show the results of each individual transaction.
1. ENGLISH NON-SDA
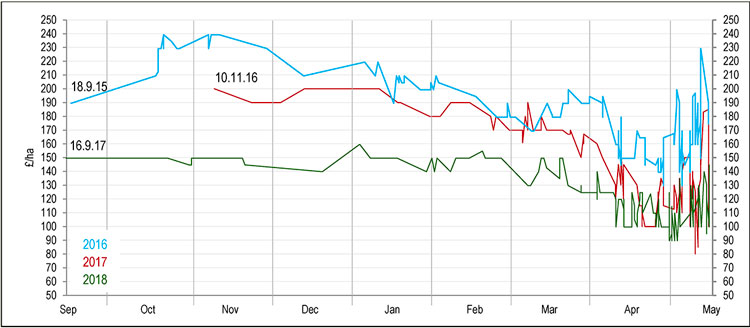
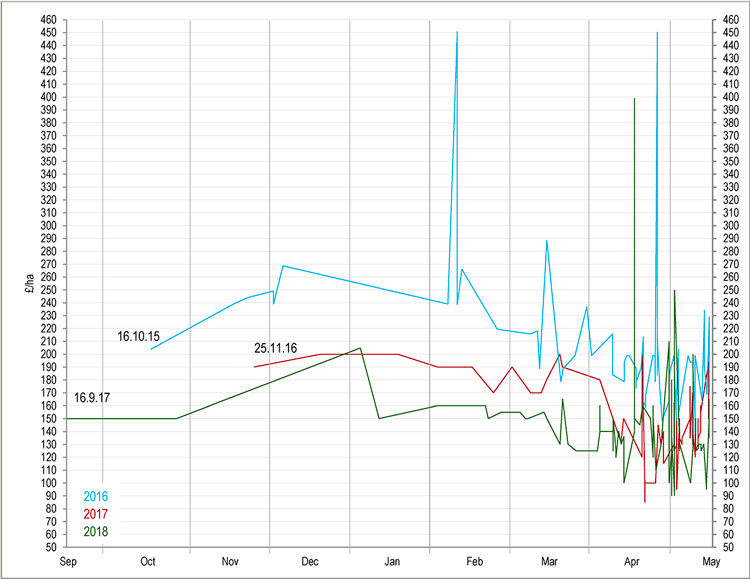
Graph A – Non-SDA VAT registered sales of >10 ha
1.1 General market factors in 2018 trading period
1.1.1 Trading started in September 2017 with a devalued pound at €1 = £0.88, which indicated a claim payment, based on the 2016 payment rates, of £213 per ha as at 16.9.17, which was a 3.25% increase on the 2016 claim payment.
1.1.2 During the trading period, uncertainty about Brexit continued to dominate the agenda with queries as to the UK’s fallback position whereby we could trade with the rest of the world under WTO rules. It would become increasingly clear that this was complicated and with a timescale that could leave the UK stranded for many years without trade agreements. There was some let up from the “doom and gloom”, with the UK’s divorce, in political terms at least, being agreed in December 2017 with the EU.
1.1.3 In early January, Michael Gove’s comments at the Oxford Farming Conference confirmed that the Government would pay the 2019 BPS scheme on the same basis as before. He also referred to a five-year transitional period from the end of the 2019 BPS scheme year. His aim was that in another seven years BPS payments would be replaced with a system of “public monies for public goods”. He also referred to capping payments to larger farmers.
1.1.4 On the 20th February the RPA confirmed England had dropped the Active Farmer rule for BPS. This removed the claimant’s need to meet certain criteria (36ha / agric. income >40% / BPS Payment >5% of non-agric. receipts) and having to provide evidence (e.g. accountant’s certificate) of being an “Active Farmer”. It also meant that certain claimants that were previously excluded (airports, railways, waterworks, real estate services, permanent sports, recreation grounds and other owners/users of land) who had had to sell their entitlements before the 2015 claim deadline, would now be eligible to make a BPS claim again for 2018 moving forward.
1.1.5 In 2018 the BPS online claim forms were available from the 12th March.
1.1.6 The online entitlement transfer screen went live unusually early on the 16th January.
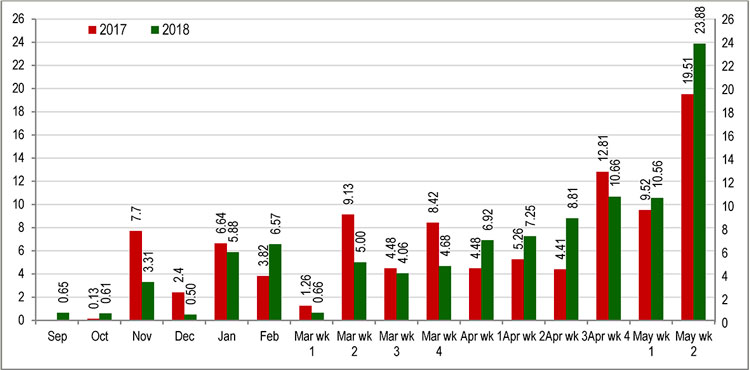
Graph B – Percentage volume of all Non-SDA sales in months and weeks
1.2 General market analysis
1.2.1 Our first sale for the 2017-2018 season was agreed on the 15th September 2017, with the seller accepting an offer just above the average sale price for the preceding season (£144) at £150 per entitlement plus VAT. The exchange rate for the 2017 scheme year was announced at the end of September at €1 = £0.89470, which was an improvement on the previous year and which gave an estimated payment per entitlement of £227.76 for claims to be paid in December 2017, using the 2017 payment rates. With Brexit weakening Sterling against the Euro, the overall feeling was that Sterling could stay at this sort of level for the foreseeable future, and maybe all the way to September 2018 (when the exchange rate for 2018 claims will be confirmed). Trade however remained slow throughout October but picked up considerably in November, with a number of sales being agreed at between £140-150, before slowing again in December.
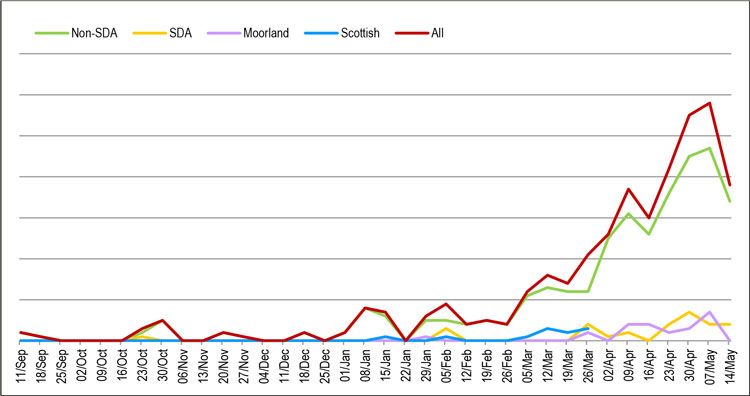
Graph C – 2018 Weekly flow of trade
1.2.2 After the Christmas break, by mid-January demand had started to pick up from buyers (with a similar number of sellers coming to the market) and the price remained firm at £150 for all mid-sized lots. There was steady demand throughout February and the beginning of March, with prices being achieved between £150-160 for VAT and Non-VAT sales. The expected increased demand due to the “Active Farmer” rule being dropped on the 20th February did not materialise however. By the second week of March savvier buyers were coming to the market who in some cases were looking for sizeable lots (50+), and there were a few sales agreed at £130 plus VAT by sellers with large amounts to sell. However most average sized lots were still selling at between £140-160 until the last week of March when more and more sellers came to the market (through ourselves and other entitlement agents). The market then became more competitive, and sales began to be agreed at between £125-140 per entitlement.
1.2.3 As we went into April prices were at £125 and, other than the odd sale, continued at this level until the second week. It then hit £120 and started oscillating between £100 and £125 until the end of April. In the last two weeks of trading before the deadline the lowest price was £90 per hectare whilst the highest was £250 for small lots, but otherwise prices averaged at £140. The last day of trading saw prices for reasonably sized lots rise to £145 and the smaller lot sizes sold at between £150 and £165.
Graph D – Non-SDA VAT registered sales of <10 ha
1.2.4 Demand for small lots
As can be seen from Graph D demand for lots less than 10 hectares remained steady from the beginning of December to the end of March, averaging £150 per hectare, and then only dropping to £140 for April with the usual ups and downs in the last few weeks of trading but ending as high as £165 on the last day. If one compares this with Graph A for sales of over 10 hectares it shows at times in March, but certainly during April, there was a considerable differential in price between the different sizes of lots. This encouraged some vendors to sell their larger blocks of entitlements in smaller lots to obtain these higher prices which gave a higher net price even taking into account multiple minimum transaction costs.
Graph E – Non-SDA VAT registered sales – all lot sizes
2. ENGLISH NON-SDA NON-VAT
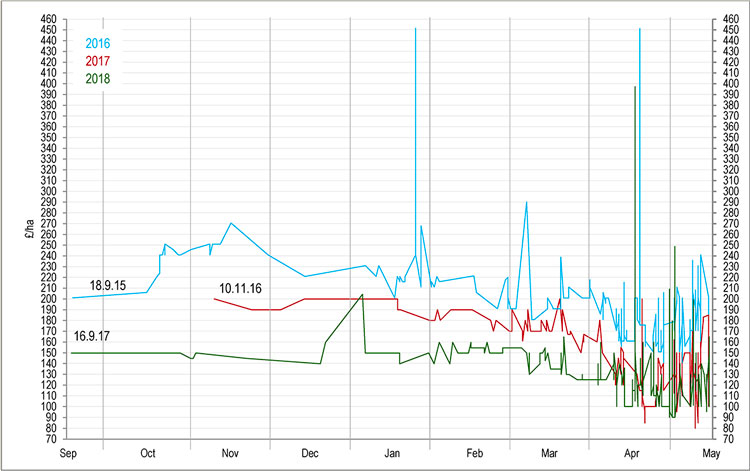
Graph F – Non-SDA Non-VAT sales – all lot sizes
2.1 Prices for non-VAT entitlements showed their usual appeal to purchasers who were not registered for VAT themselves. The market for non-VAT was steadier and at most times at a premium compared to VAT sales until the second week in April, when a lot of sales lost this premium over the last four weeks as the deadline loomed closer. However there were fewer non-VAT buyers, and most were only looking for small lots, so it was not always easy to match up buyers and sellers.
| Graph G – Non-SDA Non-VAT registered sales <10 ha | Graph H – Non-SDA Non-VAT registered sales >10 ha |
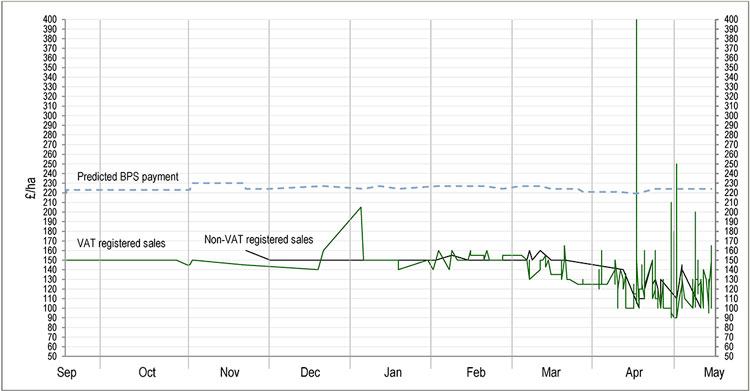
Graph I – Non-SDA – 2018 – All lot prices against predicted BPS payment
3.1 SDA
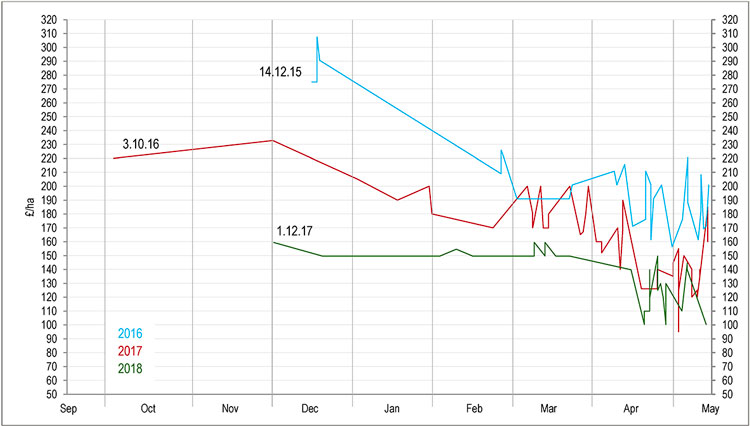
3.1.1 The trade in SDA entitlements got off to an early but measured start for 2018 entitlements, with the first sale agreed in October at £175/ha, lower than the 2017 average of £208 but still achieving the usual premium over Non-SDA which at the time was trading at £150/ha.
3.1.2 Following this, trading remained dormant until the end of January/beginning of February, when the season began in earnest and sales were agreed at £180/ha. Prices then improved, and remained steady at £210/ha until the beginning of April which saw a return to sale prices of £180/ha before another rise to £210/ha. Prices fluctuated through April and into May, with sellers achieving between £175 and £210/ha. By the second week of May prices had dropped as low as £150/ha, before rising again in the final days to as high as £220/ha. The last sales of the season were agreed at £185/ha, with a season average of £192/ha.
Graph J – SDA – all lot sizes – VAT and Non-VAT registered sales
3.1.3 There has been a continuing trend over recent years of SDA achieving higher prices than Non-SDA, and the 2018 year was no exception. The size of the market has usually been a factor in this, as has the smaller supply available. However, this year the demand was significantly lower for SDA entitlements which depressed the price somewhat toward the end of trading, and several farmers who did not need to sell this year chose to hold out to see what next year’s market brings. The total number of hectares traded was notably smaller this year than in 2017, although the number of sales agreed remained similar. This was a trend seen across the English entitlement markets, and is perhaps representative of the uncertainty felt throughout the UK agricultural industry, as farmers chose not to invest too heavily in a scheme that they could not be confident would reward them in the long term.
3.1.4 There were few sales of non-VAT SDA entitlements, and the average achieved was £210/ha.
3.2 SDA Moorland
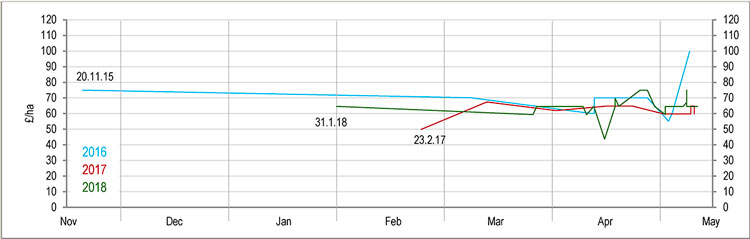
3.2.1 Moorland entitlements remained in short supply in the 2018 trading year, echoing trends seen in previous years. The first sale of the year came at the end of January 2018 at a price of £65/ha (£62.60 in 2017), notably slightly higher than the payment value of the entitlements themselves. Trading then remained steady through to April, with prices sitting at £60-65/ha, with only one outlying sale agreed below these prices at £45/ha. By the final week of April prices had risen further to £75/ha as supply dried up almost completely throughout the country, however the introduction of several larger vendors to the market at the close of April brought prices of reasonably large lots back down to around £65/ha.
3.2.2 Sales continued to be agreed between £65 and £75/ha, dependant on lot size, through the first two weeks of May, with the market closing at £65/ha. The average price paid for Moorland entitlements this season was £65.11/ha, with just over half the number of hectares sold compared to last year, but with 27.8% more lots sold. The general scarcity of Moorland entitlements again this year meant this market remained strong, and prices remained high throughout the season, only occasionally dipping below the payment value of the entitlements.
Graph K – SDA Moorland
4. LEASING
In 2018 we did not do any Moorland or SDA leasing, but we did arrange a handful of Non-SDA leases at an average price of £45/ha. With the sale price still low and the predicted BPS Payment high, this made buying rather than leasing available to those who previously could not have afforded to buy. Leasing however has not proved to be popular since it was introduced in 2015.
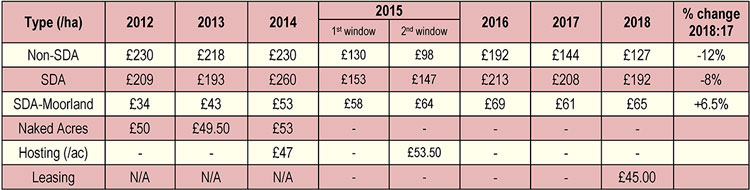
Table of comparative average sale and leasing prices for England
- Other UK Markets Report
5.1 Scotland
5.1.1 This year saw a marked increase in the number of entitlements bought and sold across Scotland, due to the reduction of the siphon applied at the time of transfer from 50% to 30%. Farmers were also encouraged by the convergence of all entitlements, including those transferred in 2018, to the flat rates next year, which meant that the effects of the siphon were lessened.
5.1.2 The continued insistence by the RPID on using paper PF23 forms to apply to transfer entitlements has meant that transfers are processed manually, and as a result all sales agreed for Scottish entitlements are likely to be subject to delays in being confirmed. Even at the 2018 trading deadline (3.4.18), some 2017 transfers were still being processed at the Stornoway office, and the RPID advised us that similar delays may be experienced for 2018 transfers. The combination of an increase in transfer applications submitted across Scotland, along with the continued use of paper forms which must be manually processed, meant that the RPID this year increased their handling capacity, with two extra entitlement offices being added in Oban and Balivanich. Hopefully this should keep any delays in processing 2018’s transfer applications to a minimum. At the time of writing all transfer applications submitted by this firm, however, have now been confirmed.
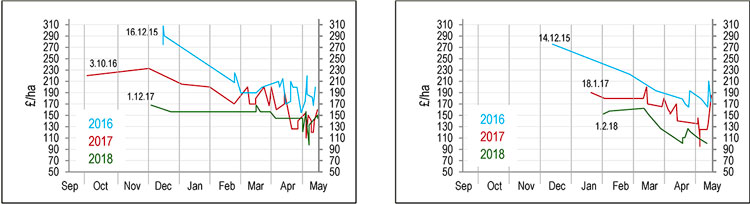
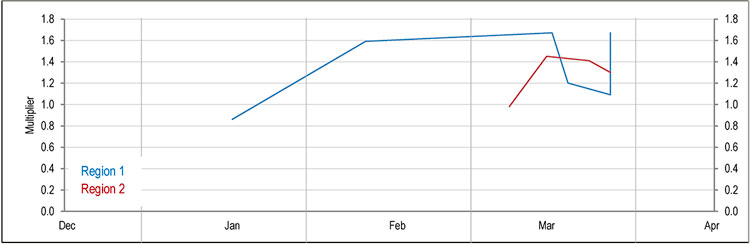
5.1.3 Trading started for Region 1 (R1) entitlements in January with a multiplier of 0.86 times face value, before rising as high as 1.59 times face value in the following weeks. Interest remained strong throughout February and into the beginning of March, although the market quietened. The second week of March saw the market get into full swing with the deadline for transfer applications being moved back a day to the 3rd of April due to the bank holiday on the 2nd.
5.1.4 By the 16th of March multipliers had risen to 1.67 times face value for R1, before dipping to 1.2 times face value in the penultimate week of trading. The last day of trading by this firm (the 27th of March) saw R1 entitlements sold at multipliers of between 1.09 and 1.67 times face value. The average multiplier for the 2018 trading season for Scottish R1 entitlements was 1.39 times face value, and the average lot size sold was 35ha, with the smallest lot being 4.65ha and the largest 143ha.
5.1.5 Interest in Region 2 (R2) entitlements remained low until the introduction to the market of a large purchaser in the first week of March. Trading got off to a subdued start, with the first R2 deal being agreed with a multiplier of 0.98 times face value, before it rose the following week to as high as 1.45 times face value. Prices remained at this level until the final week when sales were being agreed at multipliers of around 1.4 times face value, and with the final deal of the season being agreed at 1.3 times face value. The size of sales agreed ranged between 18 and 196ha, and the average lot size sold was 102ha.
Graph L – 2018 Scottish Entitlements – all lot sizes – VAT and non-VAT registered sales – Region 1 and Region 2
5.1.6 This firm saw very limited interest in Region 3 (R3) entitlements this year, with no sales agreed. The low payment value that would be achieved following the siphon meant that only the very largest landowners would make a substantial return on investment if they were to buy large amounts of R3 entitlements in 2018.
5.2 Wales
5.2.1 Much like last year, 2018’s Welsh entitlement market was again characterised by oversupply and low prices. Due to the way in which Welsh entitlements are sold with a multiplier, and the impact of the redistributive payment, some famers could see a return of around 300% on what they paid for their entitlements this year, provided those entitlements make up part of the first 54 ha of their claim.
5.2.2 Prices however remained low across Wales this year due to the oversupply, and while the bulk of trade was at face value or slightly below, multipliers as low as 0.5 times face value where not unheard of. The average multiplier for the 2018 season was 0.85 times face value (of the Basic Payment element). Due to the introduction of the flat rate payment next year, the market seemed to show little preference for high value entitlements over low value entitlements, although the highest sale multipliers achieved tended to be for higher value entitlements.
5.3 Northern Ireland
5.3.1 The lack of certainty felt throughout the UK with regard to the future of the BPS was felt perhaps most strongly in Northern Ireland, due to the continued absence of a devolved government following the collapse of the power-sharing agreement in January 2017. 2018 has also been a year plagued by issues with DAERA’s online system, in particular widely reported problems with the new online entitlement register. As in England where there were instances of discrepancies between the entitlements shown on the RPA online screen and those actually held, it quickly became apparent after the launch of the online entitlement registers, that what was shown online could not be trusted, and many farmers found themselves in the uncomfortable position of having tried to sell or lease entitlements that they did not actually hold (those entitlements usually having been clawed back to the National Reserve under the usage rules).
5.3.2 Despite these problems with the online system, the market remained vibrant this year as in previous years, with Northern Irish farmers recognising the investment value of the Basic Payment Scheme. High value entitlements remained more popular as in previous years, and the continued use of a scheme based on historic payment values meant a large variation in the values of entitlements traded. Entitlements sold on the open market achieved multipliers of between 1 and 1.5 times face value.
6. AVERAGE 2018 MULTIPLIERS OF MARKET VALUE V BPS PAYMENT RATES FOR ENTITLEMENTS SOLD ACROSS THE UK
6.1 Due to the historic payment element of entitlements in Scotland, Wales and Northern Ireland as they move to a flat rate, these entitlements have historically been sold using a multiplier. We call this the Regional Method. These multipliers are based on the Basic Payment element only of the entitlement for the scheme year in which they are being sold, and do not take into account the Greening Payment, or Redistributive Payment (Wales only). The multiplier is then applied against the estimated sterling value of the payment to be received by a successful claimant. For the 2018 year most agents used the 2017 BPS exchange rate of €1 = £0.8947 to estimate the sterling value of the entitlements. The multiplier was often further adjusted based on what type of value the BPS entitlements have, i.e. entitlements with a low value historic element have been increasing in value as they move towards the flat rate, and high value entitlements have been decreasing in value as they move to the flat rate.
6.2 An interesting comparison can be made when the same technique is applied to the sale of English entitlements: English Non-SDA entitlements had a 2017 Basic Payment value (i.e. excluding the Greening Payment) of £161.46 (at the time of writing the 2018 payment values have not yet been confirmed). If an entitlement was sold at £127/ha, this would mean it had been sold at a multiplier of 0.79 x face value (of the Basic Payment element).
6.3 The multipliers below are therefore calculated based on the Basic Payment Element of the entitlement value only, and do not take into account any Greening, or Redistributive Payment (Wales only).
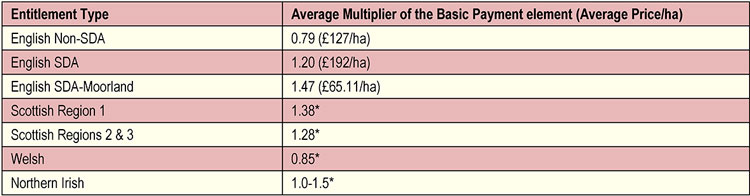
*As the payment rates in Scotland, Wales and Northern Ireland vary due to the inclusion of a historic element an Average Price per hectare is not appropriate.
7. ISSUES IN 2018 SCHEME YEAR
7.1 RPA online
The RPA online system has to cope with huge amounts of data, and has built within it rules which enable it to process certain transactions automatically, easing up on staff workloads and enabling most transactions to happen (in theory!) quickly and easily. Most transfer applications go through fairly smoothly, however no computer programme designer can foresee every possible scenario, and each year new issues arise that no-one has considered. And there were, as usual, a number of familiar glitches that arose during the 2018 entitlement transfer period.
7.1.1 We saw a number of entitlement transfer applications in 2018 go into “pending” rather than being confirmed, which happens when a farmer has not yet been paid their BPS claim in the previous year (in this case 2017), or where a Post Payment Amendment [PPA] query is being investigated for any previous scheme year claim. Both of these scenarios result in all the farmer’s entitlements being put into an unconfirmed state on the entitlements register, and therefore transfer applications for this farmer’s entitlements will then go into “pending”, ready to move to the transferee once the BPS processing or query is completed.
7.1.2 The transferred entitlements also went into “pending” if the transferee was a new applicant who had omitted to make their online active farmer declaration prior to an online transfer application being submitted.
7.1.3 And again as last year, even when the above outstanding query is/was resolved, or the BPS claim is/was finally completed, or the active farmer declaration was made online after the application was submitted, the entitlements do not automatically move over. Rather the seller’s agent has to contact the RPA and ask them to “push” the transfer through from “pending” to “complete”.
7.1.4 If however a completed PPA query results in a transferor having entitlements removed from their SBI, and they are as a result unable to fulfil their contract to a buyer, this can leave the transferor open to a compensation claim from the buyer for the lost 2018 BPS claim monies, and also for the missing entitlements.
7.1.5 The RPA had until the end of June 2018 to complete processing 2017 claims under EU rules, however there is no official deadline for resolving PPA queries, although we have been told informally by the RPA that the intention is to resolve them all before the BPS 2018 claims are processed.
7.2 New computer issues for 2018
7.2.1 There have also been some new, never-before-seen issues. For instance, in April 2018 there was an anomaly whereby one batch of transfer applications was confirmed in writing twice via our RPA messages, causing concern that the entitlements may have been transferred twice in error. When we flagged this up with the RPA it turned out it was a glitch whereby the automatic confirmation message system was doubling the message only, which required a fix by the RPA IT site support.
7.2.2 There was also a new glitch whereby in some cases entitlements were clawed back from an SBI incorrectly after only one year of non-use. Upon contacting the RPA, they were able to investigate and resolve each individual case quite quickly, however it was up to the farmer/agent to spot the error and notify them, and may have been missed by some farmers up until they submitted their claims.
7.2.3 We also came across a case where leased-in entitlements (on a long-term 5-year lease) had incorrectly been included in the “owned” entitlements column. After querying this with the RPA, we were eventually advised it was due to a “migration issue when the entitlements data was brought over into SITI from the old RITA system”. As a result our client, who had already agreed to sell the entitlements that did not belong to them, had to arrange to purchase back entitlements to enable the return of the leased entitlements for the end date of the lease in the next scheme year.
7.2.4 This year we also had a number of instances of transfer applications disappearing altogether (i.e. did not show in the Pending or Transfers In and Out tabs), and it was only because we were able to email screenshots of the transfer application to the RPA that we were able to prove we had made the application online. When this happened we were advised it was due to “functionality problems” on that particular day. And if the transfer never reappeared, the RPA was able to process the transfer for us. We had one case where a farmer tried to transfer some entitlements to a neighbour himself, and as the transfer application disappeared each time he assumed he had done it wrong, and so did it again – in this case six times! We were able to arrange for the RPA to delete the extra “stalled” transfers which in this case they could see on their “back-end” screen, but which were not showing on the “front-end” RPA online screens, and then manually transfer the correct number.
7.3 Use by date complications
7.3.1 Entitlements Transferred with a 2017 use by date
7.3.1.1 Most worryingly, in 2018 the RPA online computer system has transferred some entitlements with a 2017 use by date, and the RPA is unable to advise whether, when it runs the computerised 2018 BPS claim processing, these entitlements will be “seen” and activated by the computer for the transferee’s 2018 claim. The best advice we have been able to receive from the RPA in these scenarios is: “We think that the transferred entitlements should be usable in 2018 even though they show a 2017 use by date”.
7.3.1.2 This anomaly occurs where a farmer has been paid for their 2017 claim, but has an outstanding PPA query on payments received/areas claimed in 2015 or 2016, or where the RPA are re-examining claims in those years as is often the case for commons’ claimants (many of whose queries from 2015 still remain unresolved). Where this happens the RPA computer automatically puts the entitlements for the year of the query on hold and reverts the start of the “use by” date period for the claimant’s entitlements to the previous year until the query is resolved. However the computer’s automatic entitlement transfer process only checks the previous year’s entitlement register to ascertain whether the entitlements are available to transfer. As in this particular scenario the 2017 entitlement register shows the transferor was paid and the entitlements were activated, the computer therefore automatically transfers the entitlements, however with an incorrect use by date.
7.3.1.3 Where this happens, the RPA cannot amend the incorrect use by date manually, and the advice is the transferor should continue to submit transfer applications, and that all being well the computer will simply update once the PPA is complete. As we know, the “use by” history of entitlements should relate only to the SBI and not the entitlements, and therefore if the computer transfers them (as they were claimed on successfully in 2017) to a new SBI, the use by date relating to the transferor’s SBI should be irrelevant.
7.3.1.4 It is important to understand that in most cases PPA queries raised by claimants relate to underpayments, not overpayments, and therefore it is likely an SBI will have MORE entitlements, not less, once a query is resolved. However the RPA are unable to give any written assurances of this, or speed up the resolution of any outstanding PPA queries or the processing of outstanding 2017 (or before) claims. The RPA has confirmed that the intention is to resolve all outstanding PPA queries before processing the 2018 BPS claims, however we know their good intentions are not always achievable.
7.3.2 Incomplete Entitlement history showing online
There were in addition a small number of instances where a client’s entitlement records were simply incorrect, or missing. In one instance a farmer had claimed successfully and been paid in 2015 and 2016 but was awaiting their 2017 claim to be processed, and yet their RPA online entitlements screens did not show that any entitlements had been used in one or all of the preceding years to correctly reflect this. When this issue was highlighted to the RPA, they were able to confirm that the client had indeed had their entitlements activated in the 2015 & 2016 scheme years by checking the “back-end” screens, however they were unable to amend the “front-end” screens to correctly reflect this. Therefore although this client’s entitlements could be transferred, they would not show a valid use by date of at least 2018 (2 years from 2016), and the transferee would have no comfort as to whether they would successfully be activated by the RPA computer for their 2018 claim. The RPA could only suggest that the error would be resolved once the 2017 claim had been processed and “run through a system-based transition which should refresh the use by years allowing them to be transferred or used”.
For previous year’s trading graphs and results please click here and scroll to the bottom of the page, then click on the graphs you would like to see.

Exeter Livestock Centre, Matford Park Road, Exeter, Devon EX2 8FD
entitlements@townsendcharteredsurveyors.co.uk
www.townsendcharteredsurveyors.co.uk @TCS_Townsend