UK ENTITLEMENT TRADING MARKET REPORT – JUNE 2016
ENGLISH NON-SDA
In this year’s edition of our market report summary, we are publishing for the first time raw data graphs illustrating in detail how the different markets behaved during the trading period, which for Non-SDA started at the end of August/beginning of September 2015, and ended on the 16th May 2016. Graph A below is the type of results we have published before, which excludes any lots sold of less than 10 ha as these tend to sell at a higher price. But because of the raw data now used, there have been no adjustments such as averaging prices for a week or a day, rounding up or down, and included are any contributions made by purchasers of small lots for the vendor’s sale costs. These graphs now show the results of each individual transaction.
The trade
Subsequently, and particularly towards the end of the trading window, the Non-SDA (and SDA) graphs show violent variations even in a single day, in marked difference with previous years, especially during the last month which was a “roller-coaster” where the price rose and fell repeatedly as we approached the deadline based purely on supply and demand. In previous years the market has been generally more stable, whether falling or rising, other than in the dying days of last year’s exceptional trading conditions, of “use it or lose it”, when the price doubled in a matter of days.
Fewer entitlements traded
As many entitlements change hands without going onto the open market, and which therefore do not affect the market place, whatever the RPA figures are as to the number of entitlement transferred it is always difficult to assess what number of entitlements were sold on the open market. Most agents have confirmed our suspicion that a fewer number of entitlements were put on the open market this year than previously. This would explain perhaps in part the sensitivity of the market price in 2016, and how easily it was affected either by a single big buyer or big seller. It is interesting to surmise as to how even more volatile it could have been towards the end, if claimants with common land had had the common land part of their claims processed in time to know how many entitlements they had following their 2015 claim, and in some cases (such as the New Forest) what eligible area would be available for their 2016 claim. So, whilst some commoners still gambled by buying and selling, the market could potentially have been even more volatile. Subsequently in 2017, we believe, the commoners’ effect on the market is likely to have a high impact, once the RPA have provided them with the information they need. Our average lot size sold this year was 21.4 entitlements, whereas in 2015 the average was 20.
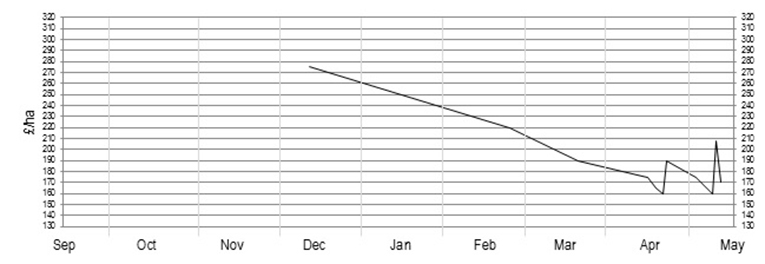
Graph A – Non-SDA VAT registered sales of >10 ha
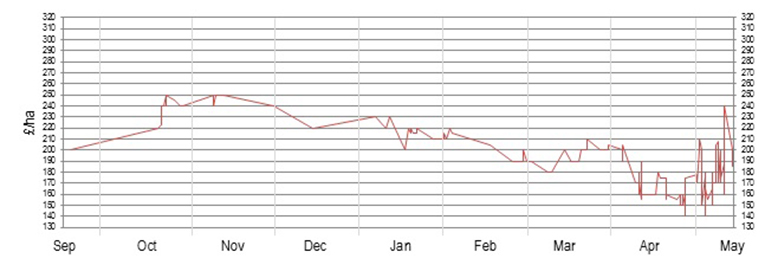
Graph A shows the sale price per ha results that were achieved throughout the season. The market started at £190 at the end of August 2015, and by mid-September was at £200 per ha plus VAT. The price steadily rose through September and by mid-October was £220, and then rapidly jumped to £240 and then £250, and remained between £240-250 until the end of November. The motivation of the market at this time was based on the fear that the RPA would have confiscated a high number of entitlements in 2015 (the “use it or lose it” year) due to them not being claimed on or sold, which could result in a shortage in availability. There were plenty of claimants who had previously rotated their entitlements under the old usage rules in the hope that they would acquire more land the next year, and therefore kept a “bank” of extra entitlements just in case. It seems unlikely the RPA will be able to confirm the exact number of entitlements that were confiscated in 2015, and the overall number of entitlements available will of course also have been affected by applications to the National Reserve and allocations of new entitlements for young farmers and new entrants. These applications were not only the counter-argument to the possibility of there being fewer entitlements rolling forward from 2015, but there was a noticeable increase in the number of large claimants disposing of their entitlements, relying on such applications to the National Reserve for 2016.
From the beginning of December generally the market followed a steady decline until the beginning of March when it appeared to “bottom out” at £180, and then bounced back, rising during March to a peak of £210. However by the beginning of April it had declined again and by mid-April the price was £160. From this point on the “roller coaster” started until the deadline, with rapid rises and falls. The lowest price traded was at £140, but there were only a few buyers lucky enough to achieve this, as some vendors decided to risk the effect of the EU Referendum and were prepared to wait and sell in 2017. Generally these vendors did not consider offers at anything less than £200, and the interest shown so far in the 2017 market indicates that it will take off at between £190 and £200. The average sale price for Non-SDA VAT registered lots of over 10 ha 2016 was £187 per ha.
So the 2016 market started at £190-200, and probably averaged out in the end at between £180-190 in the closing weeks.
Applying the Financial Discipline Mechanism, but ignoring the relief on the threshold of the first €2,000, the average sale price of Non-SDA for all lot sizes with VAT in 2016 of £192 showed a return of £178.85, a 93% return in the first year, just short of face value. The average price in 2016 was just over 16.5% lower than in 2014, which was the last year of the Single Payment Scheme, and the last most comparable year of trading, ignoring the exceptional market conditions in 2015.
Graph B – Non-SDA VAT registered sales of <10 ha
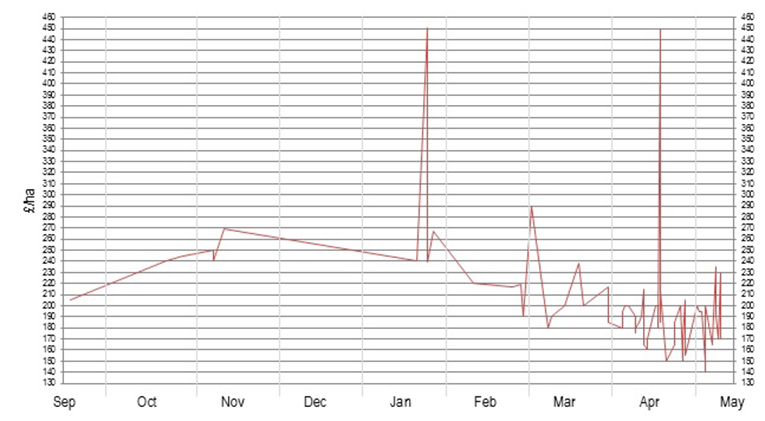
Graph B above illustrates the effect of transaction costs whereby a sale of a small lot attracts effectively disproportionately high sale costs for the vendor, requiring the purchaser to pay a higher price. The difference in price a small buyer was prepared to pay was marked during the 2016 market until the last four weeks of trading when it became less of a differentiating factor as all transaction costs rose towards the deadline. The three distinct spikes in value before May were for lots sized between 0.88 ha and 2.15 ha. The average price achieved for VAT registered lots of Non-SDA under 10 ha in 2016 was £203.
Graph C – Non-SDA VAT registered sales – all lot sizes
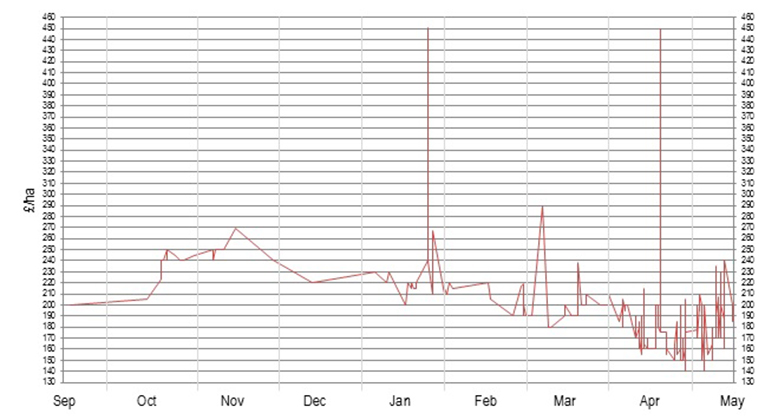
Graph C effectively combines Graph A & B and illustrates how the smaller lots “pull up” the price to give an overall average price of £192 for VAT registered Non-SDA sales in 2016.
Graph D – Non-SDA Non-VAT sales – all lot sizes
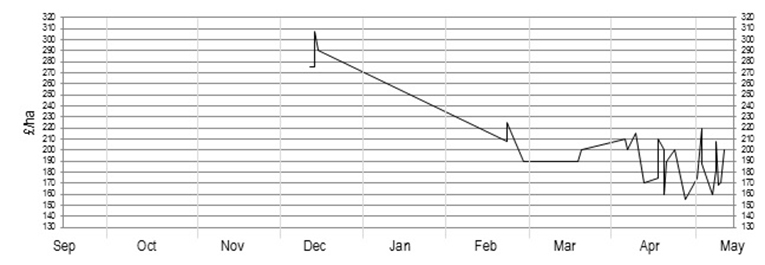
Comparing Graph D with Graph A, this illustrates the premium paid by Non-VAT registered purchasers buying from Non-VAT registered vendors. The average 2016 Non-VAT Non-SDA sale price was £204.
Graph E – Non-SDA Non-VAT registered sales <10 ha

Graph E illustrates the premium paid for small lots of Non-VAT registered entitlements, which whilst still greater than VAT registered sales, is slightly reduced due to the higher price being paid in any event for small lot sizes. The average price paid for small lots of Non-VAT Non-SDA in 2016 was £207.
Graph F – Non-SDA Non-VAT registered sales >10 ha
Graph F illustrates the premium still being paid for the larger lots of Non-VAT registered Non-SDA, but generally at a lesser rate than the small lot sizes. The average price however for larger lots of Non-VAT Non-SDA in 2016 was £189, due to the last vendors being prepared to sell at reduced prices towards the end of trading.
ENGLISH SDA & SDA MOORLAND
SDA – all lot sizes – VAT and Non-VAT registered sales
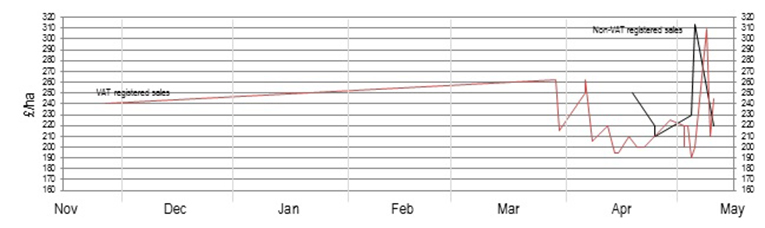
SDA entitlements started strongly in December at £240, showing their usual premium due to the normal lack of supply compared with Non-SDA, despite the fact the SDA payment is £1 less per ha. However the market was then very quiet until the end of March 2016 dropping to £215. Both demand and supply picked up from mid-April and the market reflected the Non-SDA price “roller coaster”, with prices varying from £190 (the bottom of the market) for a VAT registered buyer, up to £309 per ha for a purchaser of a small Non-VAT lot close to the deadline when the transaction costs made it financially unviable for a vendor to sell at a lower rate. The average price for 2016 SDA entitlements for a VAT registered sale was £213, and for a Non-VAT registered sale was £230.
SDA-Moorland
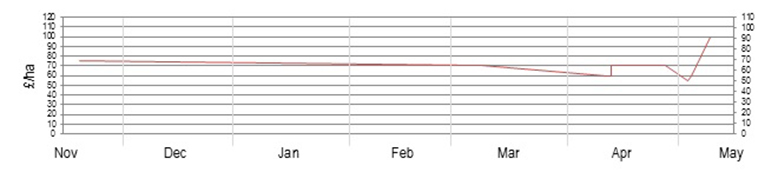
There was a marked shortage of supply in Moorland entitlements this trading season despite steady demand, and subsequently the serious buyers were prepared to pay between £55 and £75 throughout the season, depending on lot size, when they could find it. Ultimately in 2016 the demand was not satisfied. We only had VAT registered Vendors in 2016, and the average price was £69.
LEASING, HOSTING AND NAKED ACRES
Under the new BPS scheme, the RPA took the opportunity to accept the logic of introducing a without land leasing scheme, which effectively now replaces naked acre letting or hosting arrangements. As an agency we did not introduce the leasing scheme for 2015 with the risks of the RPA not being able to operate it successfully in its first year, combined with the risk of a lessee not making an appropriate claim in the “use it or lose” year, and the entitlements being confiscated. There was less risk of this in 2016 as any unused entitlements would not have been confiscated. However, whilst there was some demand and supply, our agency did not complete any open market leases. In 2017 the risk of a lessee not claiming appropriately and losing the entitlements may return, but we suspect there will be more trade, especially for those that are still holding entitlements that they have not used in 2016, and their other options are selling them or losing them in 2017. As experienced in 2016 where leases were entered into in 2015, particular care is needed with the online system as to the date the leased entitlements are scheduled to return to the lessor.
AVERAGE PRICE OF ENTITLEMENTS IN ENGLAND 2012-2016
| Scheme Year | 2012 | 2013 | 2014 | 2015 | 2016 |
| Non-SDA (per ha) | £230 | £218 | £230 | £98 | £192 |
| SDA (per ha) | £209 | £193 | £260 | £147 | £213 |
| SDA-Moorland (per ha) | £34 | £43 | £53 | £64 | £69 |
| Naked Acres (per ac) | £50 | 49.50 | £53 | – | – |
| Hosting (per ac) | – | – | £47 | £53.50 | – |
WELSH, SCOTTISH AND NORTHERN IRISH
We did not trade any of these entitlements during the 2016 trading windows. Uncertainty within these markets caused by last minute scheme changes and the reliance on illustrative figures for the value of the entitlements meant that we felt uncomfortable trading in order to satisfy the limited supply and demand experienced across these markets.
Wales
The decision to adopt a single payment region in Wales and the 2015 payments not being completed, coupled with the introduction of a new scheme and online system, created uncertainty amongst Welsh claimants that resulted in a subdued trade compared to previous years. Trading on the basis of only ‘illustrative entitlement allocations’ without any definitive information on the actual payment value of the entitlements being provided by Rural Payments Wales (although some confirmations were issued just before the deadline) meant that entitlement owners were uncertain as to the number and historic value of entitlements they had been allocated, and therefore they did not know how many entitlements they had to sell. Similarly, the illustrative allocations failed to encourage purchasers, as it left them wondering exactly how many entitlements they would need and what the value of the entitlements they were buying actually was.
Conversations with Welsh claimants highlighted the lack of narrative from Rural Payments Wales and the eventual distribution of partial payments for 2015 did little to boost this year’s trade. Those entitlements that did sell were fetching multipliers averaging around 1.5 times the 2015 value, with greater demand for entitlements with a low illustrative historic value. These entitlements were not only cheaper but also will increase in value over the next three payment years as they reach a flat rate anticipated to be €124 in 2019. With the crash of the online system on the day of the deadline and the subsequent 10 day extension, very few trades took place in this extended period resulting in a number of entitlements left unsold.
Scotland
Virtually no trades took place in Scotland. Delays to 2015 part payments left agents and land owners with insufficient information on which to act. Entitlement agents across Scotland were reluctant to action transfers as the historic value attached to entitlements remained unknown for the duration of the trading period. Not only were entitlement values unknown, but the introduction of a 50% siphon on all without land transfers meant that almost all entitlement transfers took place in conjunction with a transfer of land, to prevent the reduction in the value of the entitlements. The implementation of the siphon is anticipated to result in more “with land” transfers, although entitlement values will continue to reach a flat rate by 2019 whether a siphon has been applied or not. The leasing out of entitlements “with land” may create an opportunity for entitlement owners in Scotland to retain the entitlements, whilst not incurring the 50% siphon. This being said, all leases must be within the same payment region for the same period of time as the entitlement lease.
The limited evidence available of just two entitlement trades without land have shown multipliers of 1.2 to 1.5 times the average four year predicted payment value following the application of the 50% siphon.
As yet the Rural Payments and Services have not introduced an online system by which entitlements can be transferred. As a result a PF23 form was continued to be used to transfer entitlements and led to a deadline of the 2nd April, six weeks in advance of the 15th May to ensure the paperwork was been processed before the cut-off date. In the coming year it is hoped that further information and understanding will result in the BPS scheme ‘bedding in’ resulting in a more active market.
Northern Ireland
Unlike the situation in Scotland, Northern Ireland experienced an active market despite a number of fundamental issues with the implementation of the new BPS rules. The lack of clarification on many applicants’ “active farmer” status led to over 7,000 farm businesses receiving letters from the Department of Agriculture suggesting they may not meet the active farmer rule. This, along with the release of provisional data on the value of the entitlements accompanied by caveats suggesting “change cannot be ruled out at this stage”, meant that claimants had little information on which to make informed decisions.
Despite these issues, reports suggest that there was plenty of demand, particularly for entitlements with a high “illustrative” historic value. With entitlements reaching a flat rate over the next 7 years, higher value entitlements will not depreciate at the same rate as those in Wales, meaning that people believe them to be a better investment than lower value entitlements. The multipliers achieved this year ranged from 1.5 for low value entitlements to 2.5 for those with a high historic value, based on the expected 2016 value. The regional average value for entitlements in 2015, including the Greening element, was €327.13, as announced by DARDNI back in November 2015.
The introduction of the Young Farmer payment and entitlement allocation was anticipated to reduce demand for entitlements, as many farmers considered changing their business structures in order to receive entitlements from the National Reserve, and top-up payments of €81.28 per ha. This practice did not appear to be as wide spread as predicted, however, perhaps due to the risk of these structural changes being perceived as artificial by DARDNI.
COMPLICATIONS WITH NEW RPA ONLINE TRANSFERS FOR ENGLAND
We could write at length on this subject about the chaos, frustration, risks and complications involved in 2016. However in essence this probably did not affect market prices, and hopefully are issues that will not be repeated next year. There are plenty of lessons to learn, however, as to how the system works and if you would like further advice, we hope to be publishing shortly an Entitlements Facts 2017, which will be a vital guide for farmers, agents, farm advisors and claimants involved in transferring entitlements in the entitlement market. Watch this space!
We are grateful however to our vendors and purchasers for their patience in dealing with the 2016 usage date enquiries we felt were necessary to ensure we could identify and resolve potential problems prior to an exchange of contracts. We hope we have been able to avoid post-submission complications which, without such enquiries, would have caused both vendors and purchasers unnecessary expense and risk.
For previous year’s trading graphs and results please click here and scroll to the bottom of the page, then click on the graphs you would like to see.